Arch Line Visualization
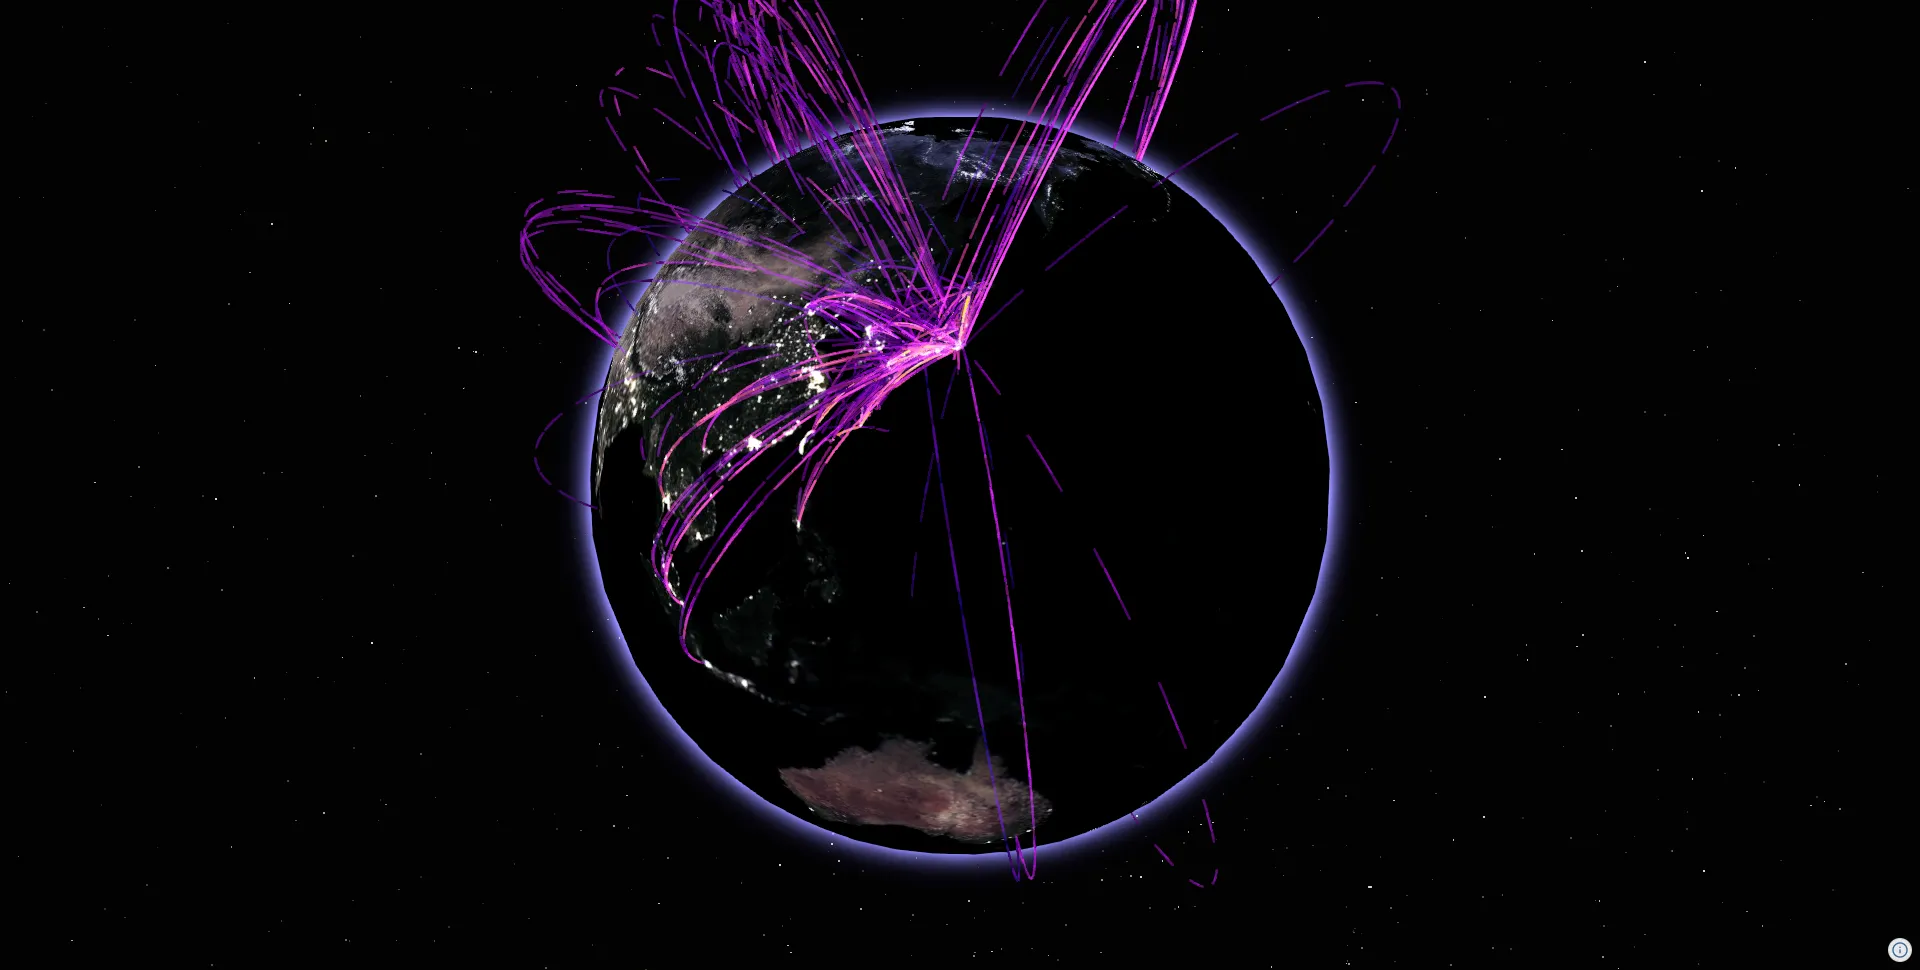
Learn how to visualize air traffic volume data between airports using arch lines (great circle routes lifted into arcs). This tutorial combines data-driven color mapping, animation, and glow effects to create a beautiful visualization.
What you will learn in this tutorial:
- Setting up a dark-themed globe view
- Configuring starfield, ambient light, and tone mapping
- Loading and processing GeoJSON data
- Data-driven color mapping using ColorMap
- Efficiently rendering multiple arch lines
- Expressing flow with dash animation
- Making the globe look beautiful with a glow effect
Basic Implementation
Section titled “Basic Implementation”First, create the base view.
import ThreeView, { Color } from "@navaramap/three";import { ToneMappingMode } from "@navaramap/three-default-descs";import { DefaultPlugin, type DefaultDescriptions } from "@navaramap/three-default-plugin";import { TileJsonPlugin } from "@navaramap/three-plugins";
const plugin = new DefaultPlugin();const view = new ThreeView<DefaultDescriptions>({  backgroundColor: new Color().setStyle("#0b0a0d"),});view.addPlugin(plugin);
const tilejson = new TileJsonPlugin();view.addPlugin(tilejson);
await view.init();
// Adjust tone mapping exposureview.toneMappingExposure = 10;
// Add ambient lightview.addLight({  ambient: {},});
// Add starfieldview.addMesh({  stars: {    intensity: 100,    pointSize: 1.5,  },});
// Add tone mapping effectview.addEffect({  toneMapping: {    mode: ToneMappingMode.REINHARD2,  },});
// Add anti-aliasing (SMAA)view.addEffect({  smaa: {    quality: "ultra",  },});
// Base satellite imagery tilesconst satelliteSource = await tilejson.addSource({  type: "raster-tile",  url: "https://papers.reearth.land/bluemarble/tilejson.json",});view.addLayer({  type: "raster",  source: satelliteSource,});
// Set camera to a position where the entire globe is visibleview.setCamera({ lng: 140, lat: 20, height: 12_600_000, heading: 0, pitch: -90, roll: 0 });
Adding Night Tiles
Section titled “Adding Night Tiles”To create a more beautiful nighttime Earth, overlay night tiles (NASA Earth at Night).
// Add night tiles (overlaid with transparency)const nightSource = await tilejson.addSource({ type: "raster-tile", url: "https://papers.reearth.land/blackmarble/tilejson.json",});view.addLayer({ type: "raster", source: nightSource, raster: { opacity: 0.8, // Overlay with transparency },});Adding a Glow Effect
Section titled “Adding a Glow Effect”import type { GlowGlobeMeshDesc } from "@navaramap/three-default-descs";
// Add globe glow effectview.addMesh<GlowGlobeMeshDesc>({ glowGlobe: { radiusScale: 1.2, coefficient: 0.43, exponent: 40.0, glowColor: new Color().setStyle("#938cff"), opacity: 0.5, },});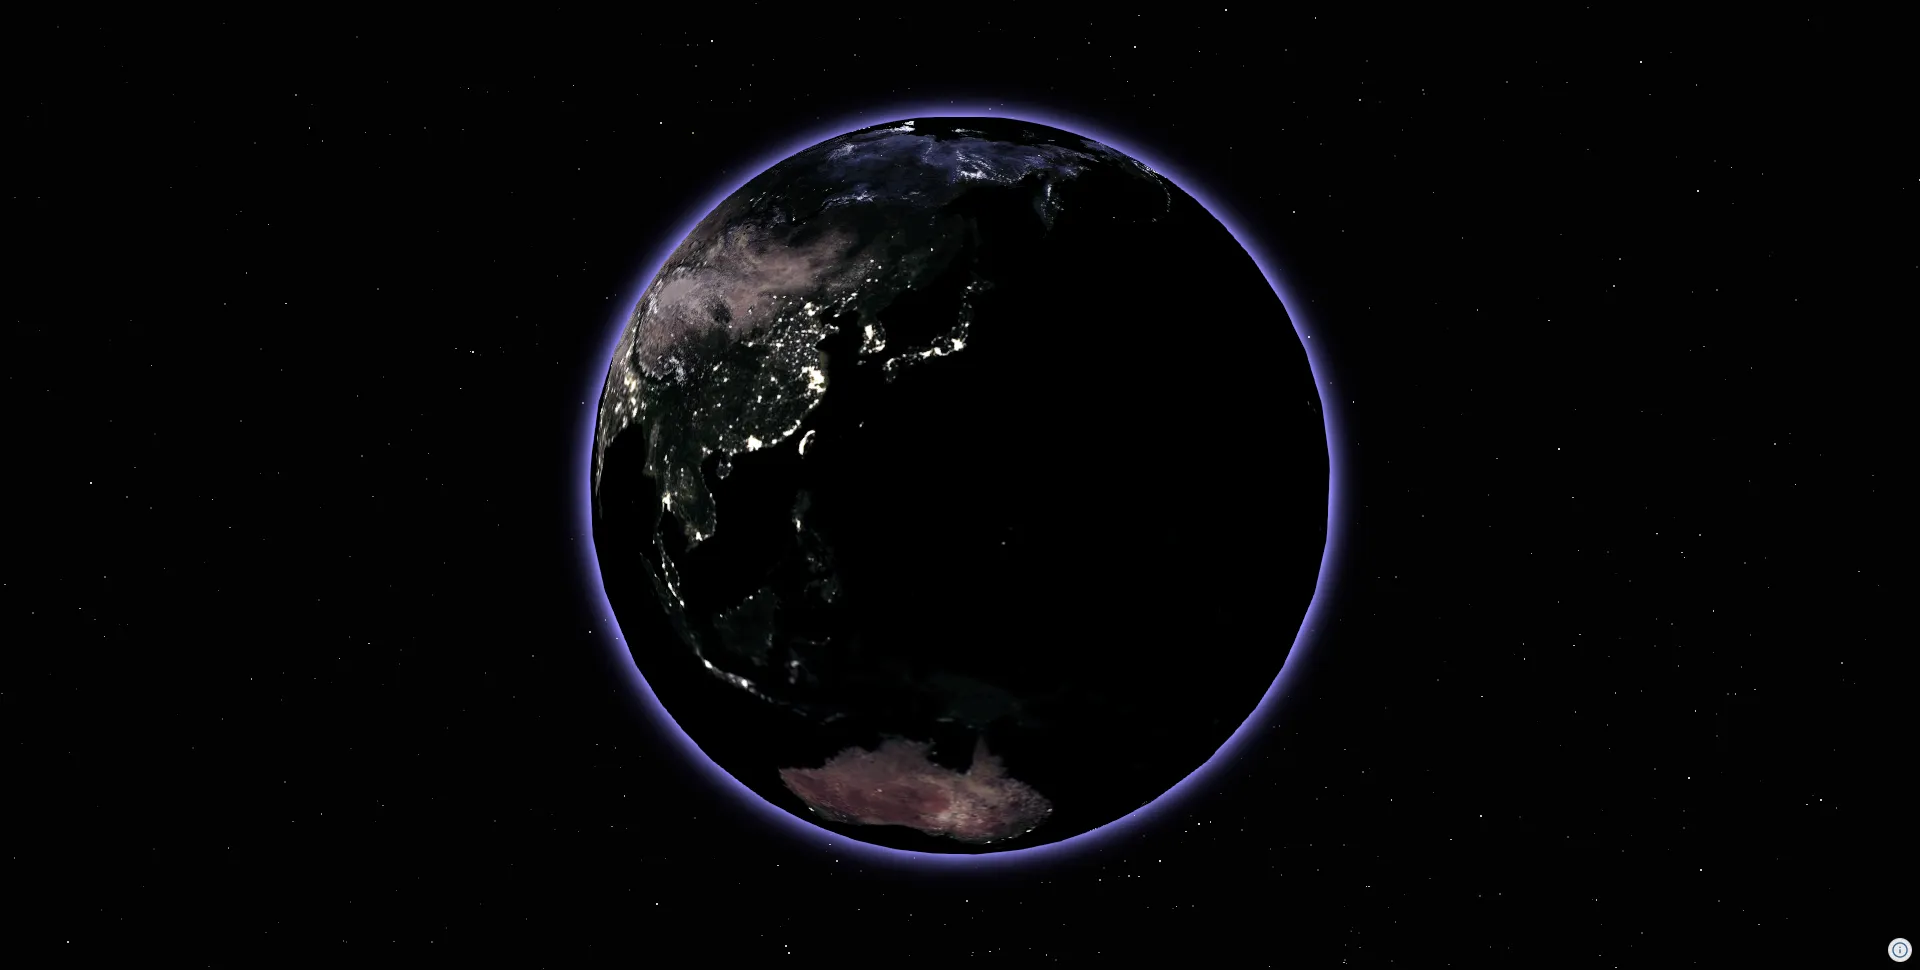
Loading GeoJSON Data
Section titled “Loading GeoJSON Data”Load air traffic volume data between airports in GeoJSON format.
import type { FeatureCollection, MultiLineString } from "geojson";
// Type definition for air traffic volume datatype AirportTrafficData = FeatureCollection<  MultiLineString,  {    S10b_001: string; // Departure airport    S10b_004: string; // Arrival airport    S10b_005: number; // Distance    S10b_006: number; // Number of flights    S10b_007: number; // Number of passengers    S10b_008: number; // Total transport volume    S10b_009: number; // Cargo volume  }>;
// Fetch dataconst response = await fetch( "https://assets.cms.reearth.io/assets/3b/63858d-9197-4b39-bbed-c17b6add52a4/airport-traffic-volume.geojson");const data: AirportTrafficData = await response.json();Data-Driven Color Mapping with ColorMap
Section titled “Data-Driven Color Mapping with ColorMap”Using the ColorMap class, you can map numerical data to colors. Here we assign colors based on the number of flights.
import { Color, ColorMap, geodeticToVector3 } from "@navaramap/three";
// ref: https://matplotlib.org/stable/users/explain/colors/colormaps.htmlconst PLASMA_COLORMAP = new ColorMap("sequential", "Plasma", [  [0.050383, 0.029803, 0.527975],  [0.494877, 0.011990, 0.657865],  [0.798216, 0.280197, 0.469538],  [0.994324, 0.716681, 0.177208],]);
// Get the maximum number of flights (normalized on a logarithmic scale)const maxTrafficLog = Math.max(  ...data.features.map((f) => Math.log(f.properties.S10b_006 + 1)));
// Convert each GeoJSON feature to an arch line definitionconst arcLines = data.features.map((feature) => {  const coords = feature.geometry.coordinates[0];  const source = { lng: coords[0][0], lat: coords[0][1] };  const destination = { lng: coords[1][0], lat: coords[1][1] };
  // Calculate distance between two points (used for animation speed adjustment)  const srcVec = geodeticToVector3({    lat: source.lat,    lng: source.lng,    height: 0,  });  const destVec = geodeticToVector3({    lat: destination.lat,    lng: destination.lng,    height: 0,  });  const distance = srcVec.distanceTo(destVec);
  // Normalize flight count on a logarithmic scale (0 to 1)  const trafficVolume = feature.properties.S10b_006;  const trafficVolumeLog = Math.log(trafficVolume + 1);  const normalizedTraffic = trafficVolumeLog / maxTrafficLog;
  // Get color from ColorMap  const [r, g, b] = PLASMA_COLORMAP.linear(normalizedTraffic);  const color = new Color().setRGB(r, g, b);
return { thickness: 1.2, transparent: true, opacity: 0.3, segments: 64, height: 0, arcHeightScale: 0.3, srcColor: color, tgtColor: color, dashed: true, dashSize: 500000, dashOffset: Math.random() * 1000000, // Random initial offset gapSize: 800000, geometry: [source, destination], distance, // Used for animation speed calculation };});Adding the Arch Line Object
Section titled “Adding the Arch Line Object”import type { ArclineMeshDesc } from "@navaramap/three-default-descs";
const arcLineHandle = view.addMesh<ArclineMeshDesc>({ arcLines,});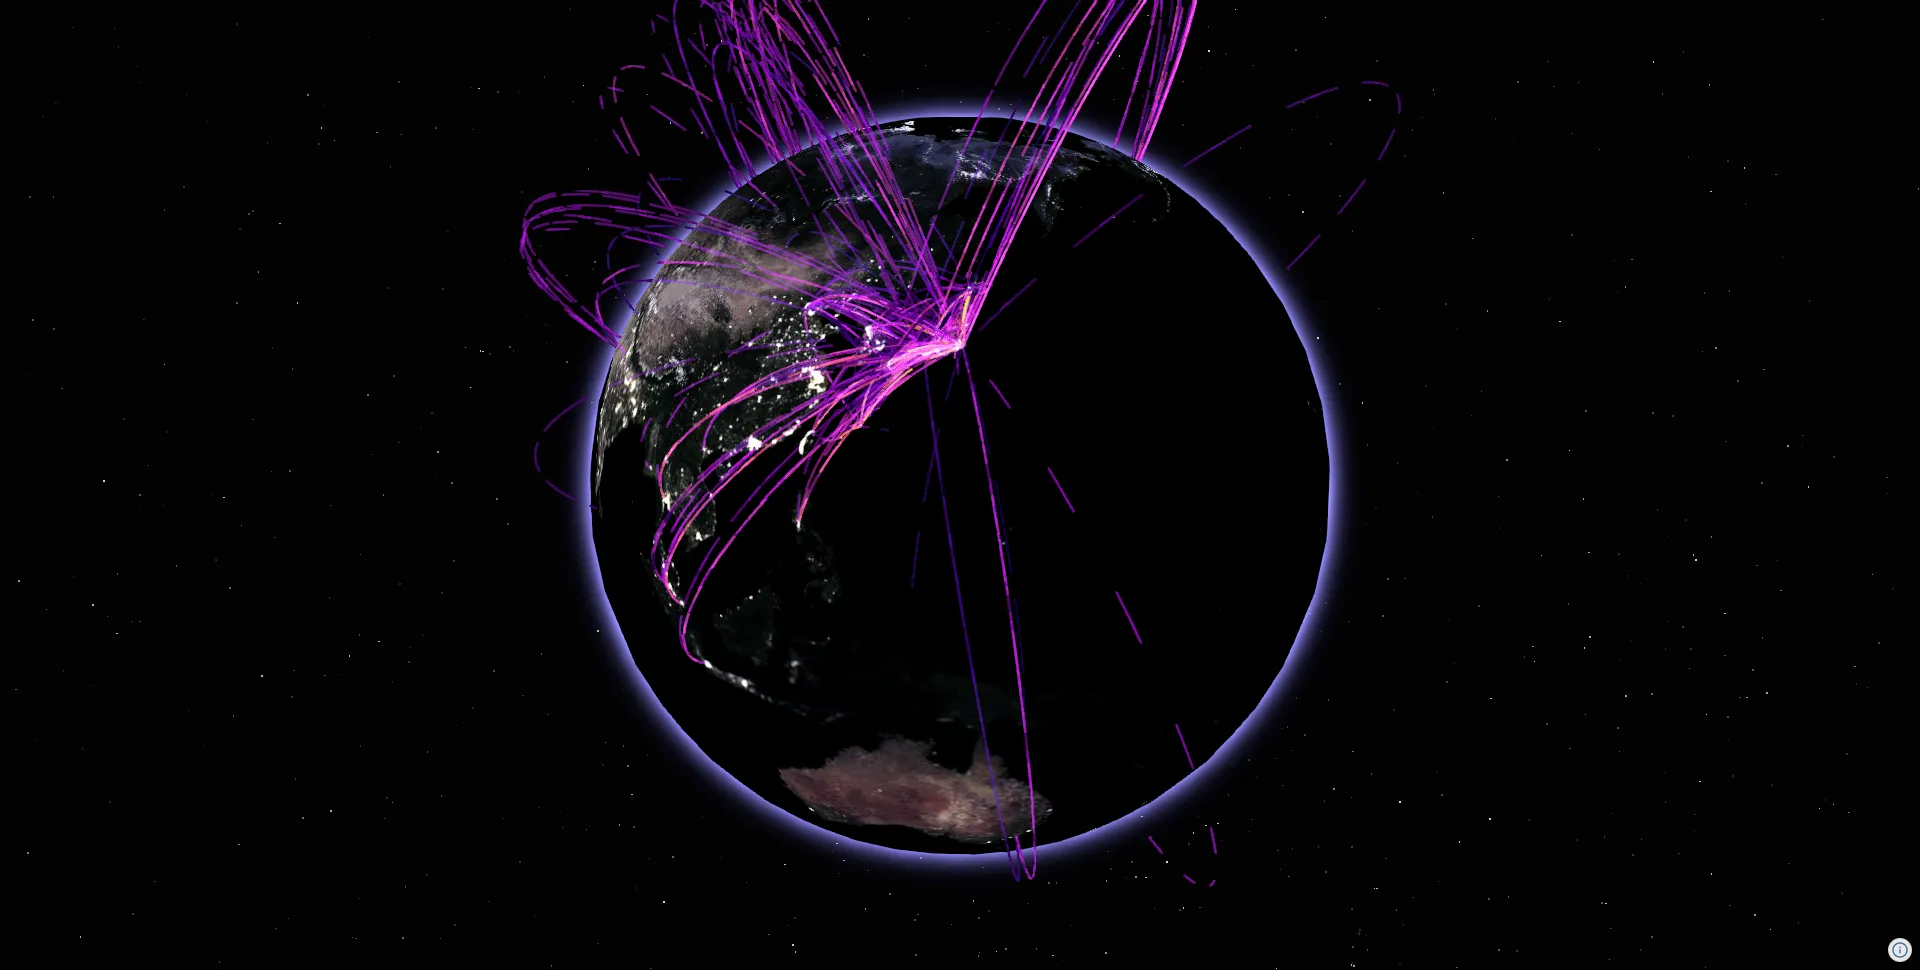
Adding Dash Animation
Section titled “Adding Dash Animation”Update the dash offset on every frame with view.on("preUpdate", ...) to express flow directionality. preUpdate fires just before the view processes a frame, so the offsets written there are picked up by the render of that same frame. Adjusting the animation speed based on distance creates a more natural appearance.
// Dash animation flowing from origin to destinationview.on("preUpdate", () => {  arcLines.forEach((arcLineDef) => {    // Calculate animation speed based on distance    const baseSpeed = 5000;    const distance = arcLineDef.distance || 1;    const speedMultiplier = Math.sqrt(distance / 2000000);    const speed = baseSpeed * speedMultiplier;
    arcLineDef.dashOffset = (arcLineDef.dashOffset ?? 0) + speed;  });
arcLineHandle.update({ arcLines });});Complete Example
Section titled “Complete Example”import ThreeView, { Color, ColorMap, geodeticToVector3,} from "@navaramap/three";import { ToneMappingMode, type ArclineMeshDesc, type GlowGlobeMeshDesc,} from "@navaramap/three-default-descs";import { DefaultPlugin, type DefaultDescriptions } from "@navaramap/three-default-plugin";import { TileJsonPlugin } from "@navaramap/three-plugins";import type { FeatureCollection, MultiLineString } from "geojson";
// Type definition for air traffic volume datatype AirportTrafficData = FeatureCollection< MultiLineString, { S10b_001: string; S10b_004: string; S10b_005: number; S10b_006: number; S10b_007: number; S10b_008: number; S10b_009: number; }>;
// ref: https://matplotlib.org/stable/users/explain/colors/colormaps.htmlconst PLASMA_COLORMAP = new ColorMap("sequential", "Plasma", [ [0.050383, 0.029803, 0.527975], [0.494877, 0.011990, 0.657865], [0.798216, 0.280197, 0.469538], [0.994324, 0.716681, 0.177208],]);
// Construct dataconst constructData = async () => { const response = await fetch( "https://assets.cms.reearth.io/assets/3b/63858d-9197-4b39-bbed-c17b6add52a4/airport-traffic-volume.geojson" ); const data: AirportTrafficData = await response.json();
const maxTrafficLog = Math.max( ...data.features.map((f) => Math.log(f.properties.S10b_006 + 1)) );
const arcLines = data.features.map((feature) => { const coords = feature.geometry.coordinates[0]; const source = { lng: coords[0][0], lat: coords[0][1] }; const destination = { lng: coords[1][0], lat: coords[1][1] };
const srcVec = geodeticToVector3({ lat: source.lat, lng: source.lng, height: 0, }); const destVec = geodeticToVector3({ lat: destination.lat, lng: destination.lng, height: 0, }); const distance = srcVec.distanceTo(destVec);
const trafficVolume = feature.properties.S10b_006; const trafficVolumeLog = Math.log(trafficVolume + 1); const normalizedTraffic = trafficVolumeLog / maxTrafficLog;
const [r, g, b] = PLASMA_COLORMAP.linear(normalizedTraffic); const color = new Color().setRGB(r, g, b);
return { thickness: 1.2, transparent: true, opacity: 0.3, segments: 64, height: 0, arcHeightScale: 0.3, srcColor: color, tgtColor: color, dashed: true, dashSize: 500000, dashOffset: Math.random() * 1000000, gapSize: 800000, geometry: [source, destination], distance, }; });
return { arcLines };};
// Main functionasync function run() { const plugin = new DefaultPlugin(); const view = new ThreeView<DefaultDescriptions>({ backgroundColor: new Color().setStyle("#0b0a0d"), }); view.addPlugin(plugin);
const tilejson = new TileJsonPlugin(); view.addPlugin(tilejson);
await view.init();
view.atmosphere.date.setHours(8); view.toneMappingExposure = 10;
// Ambient light view.addLight({ ambient: {}, });
// Starfield view.addMesh({ stars: { intensity: 100, pointSize: 1.5, }, });
// Tone mapping view.addEffect({ toneMapping: { mode: ToneMappingMode.REINHARD2, }, });
// Anti-aliasing view.addEffect({ smaa: { quality: "ultra", }, });
// Satellite imagery tiles const satelliteSource = await tilejson.addSource({ type: "raster-tile", url: "https://papers.reearth.land/bluemarble/tilejson.json", }); view.addLayer({ type: "raster", source: satelliteSource, });
// Night tiles (optional) const nightSource = await tilejson.addSource({ type: "raster-tile", url: "https://papers.reearth.land/blackmarble/tilejson.json", }); view.addLayer({ type: "raster", source: nightSource, raster: { opacity: 0.8, }, });
// Glow effect view.addMesh<GlowGlobeMeshDesc>({ glowGlobe: { radiusScale: 1.2, coefficient: 0.43, exponent: 40.0, glowColor: new Color().setStyle("#938cff"), opacity: 0.5, }, });
// Construct arch line data const { arcLines } = await constructData();
// Add arch line object const arcLineHandle = view.addMesh<ArclineMeshDesc>({ arcLines, });
// Dash animation view.on("preUpdate", () => { arcLines.forEach((arcLineDef) => { const baseSpeed = 5000; const distance = arcLineDef.distance || 1; const speedMultiplier = Math.sqrt(distance / 2000000); const speed = baseSpeed * speedMultiplier;
arcLineDef.dashOffset = (arcLineDef.dashOffset ?? 0) + speed; });
arcLineHandle.update({ arcLines }); });
// Camera settings view.setCamera({ lng: 140, lat: 20, height: 12_600_000, heading: 0, pitch: -90, roll: 0 });}
run();