Arch Line Visualization
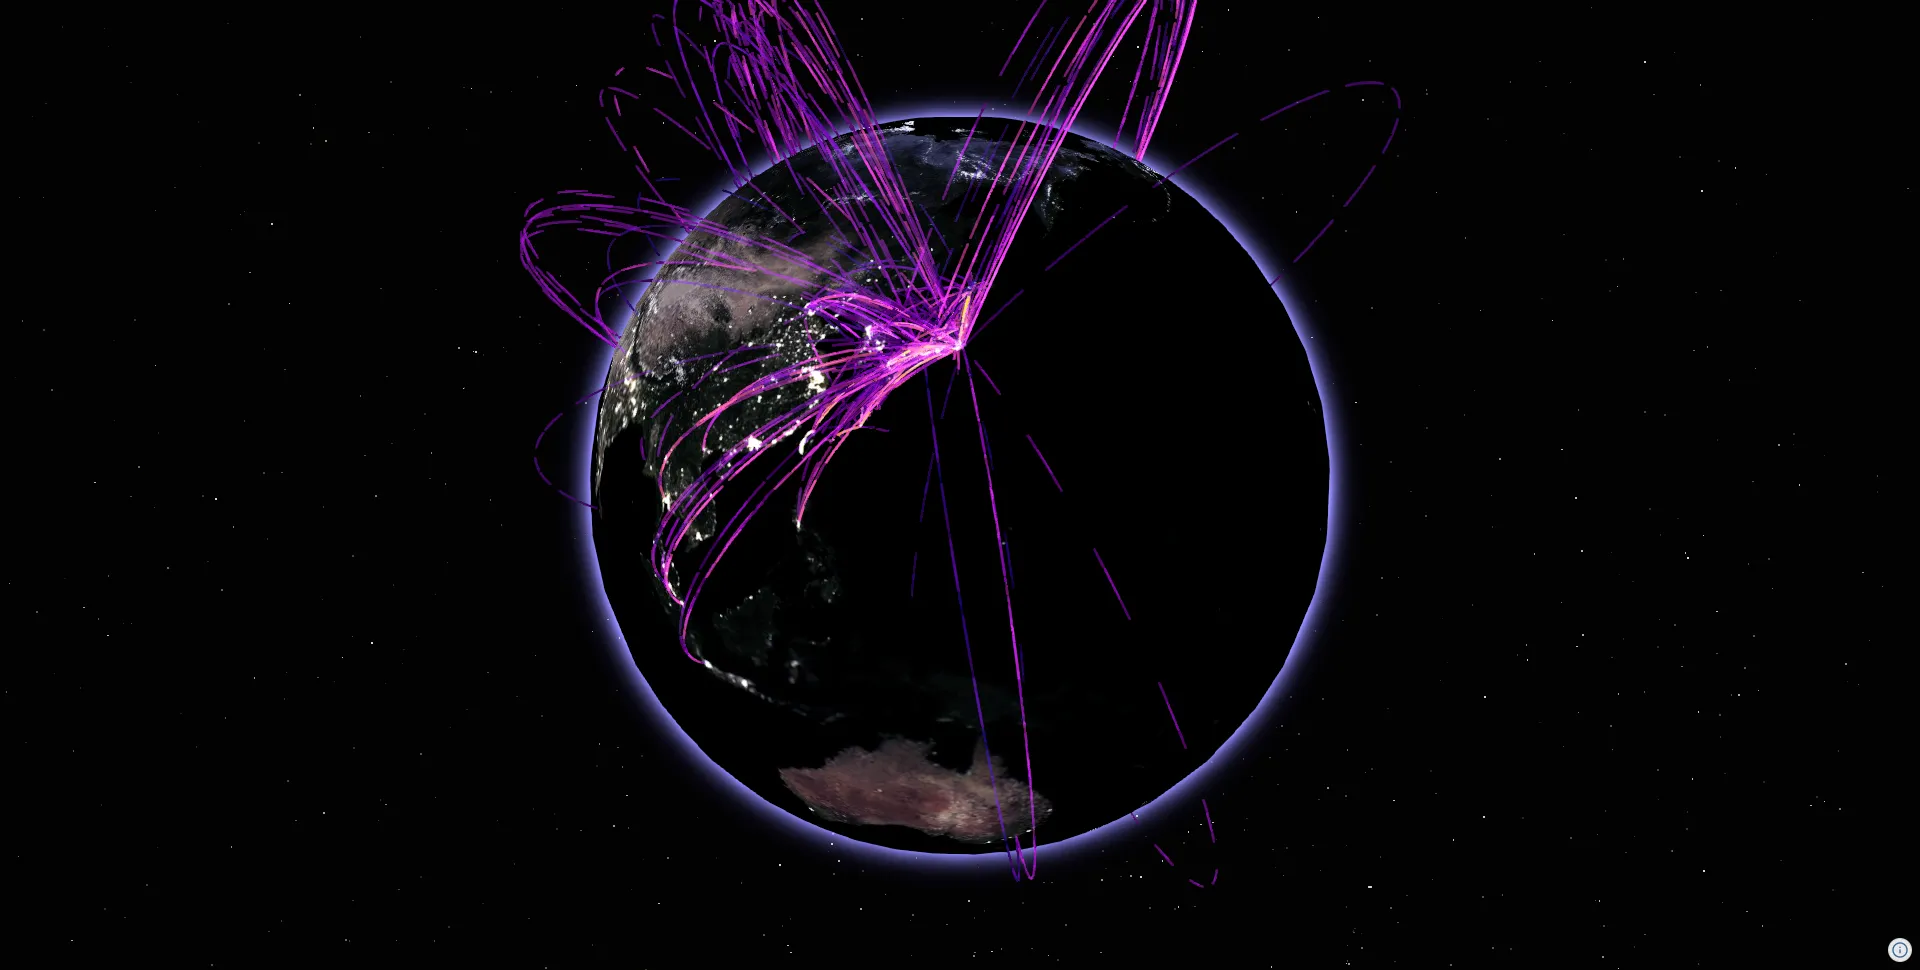
空港間の航空交通量データをアーチライン(大圏航路をアーチ状に持ち上げた可視化)で表示する方法を学びます。データに基づいた色分け、アニメーション、グローエフェクトなどを組み合わせて、美しい可視化を作成します。
このチュートリアルで学べること:
- ダークテーマの地球儀ビューのセットアップ
- 星空・アンビエントライト・トーンマッピングの設定
- GeoJSONデータの読み込みと処理
- ColorMapを使ったデータに基づく色分け
- 複数のアーチラインを効率的に描画する
- ダッシュアニメーションでフローを表現する
- グローエフェクトで地球を美しく見せる
まずベースとなるビューを作成します。
import ThreeView, { Color } from "@navaramap/three";import { ToneMappingMode } from "@navaramap/three-default-descs";import { DefaultPlugin, type DefaultDescriptions } from "@navaramap/three-default-plugin";import { TileJsonPlugin } from "@navaramap/three-plugins";
const plugin = new DefaultPlugin();const view = new ThreeView<DefaultDescriptions>({  backgroundColor: new Color().setStyle("#0b0a0d"),});view.addPlugin(plugin);
const tilejson = new TileJsonPlugin();view.addPlugin(tilejson);
await view.init();
// トーンマッピング露出を調整view.toneMappingExposure = 10;
// アンビエントライトを追加view.addLight({  ambient: {},});
// 星空を追加view.addMesh({  stars: {    intensity: 100,    pointSize: 1.5,  },});
// トーンマッピングエフェクトを追加view.addEffect({  toneMapping: {    mode: ToneMappingMode.REINHARD2,  },});
// アンチエイリアシング(SMAA)を追加view.addEffect({  smaa: {    quality: "ultra",  },});
// ベースの衛星写真タイルconst satelliteSource = await tilejson.addSource({  type: "raster-tile",  url: "https://papers.reearth.land/bluemarble/tilejson.json",});view.addLayer({  type: "raster",  source: satelliteSource,});
// カメラを地球全体が見える位置に設定view.setCamera({ lng: 140, lat: 20, height: 12_600_000, heading: 0, pitch: -90, roll: 0 });
夜景タイルを追加する
Section titled “夜景タイルを追加する”より美しい夜の地球を表現するために、夜景タイル(NASA Earth at Night)を重ねます。
// 夜景タイルを追加(半透明で重ねる)const nightSource = await tilejson.addSource({ type: "raster-tile", url: "https://papers.reearth.land/blackmarble/tilejson.json",});view.addLayer({ type: "raster", source: nightSource, raster: { opacity: 0.8, // 半透明で重ねる },});グローエフェクトを追加する
Section titled “グローエフェクトを追加する”import type { GlowGlobeMeshDesc } from "@navaramap/three-default-descs";
// 地球のグローエフェクトを追加view.addMesh<GlowGlobeMeshDesc>({ glowGlobe: { radiusScale: 1.2, coefficient: 0.43, exponent: 40.0, glowColor: new Color().setStyle("#938cff"), opacity: 0.5, },});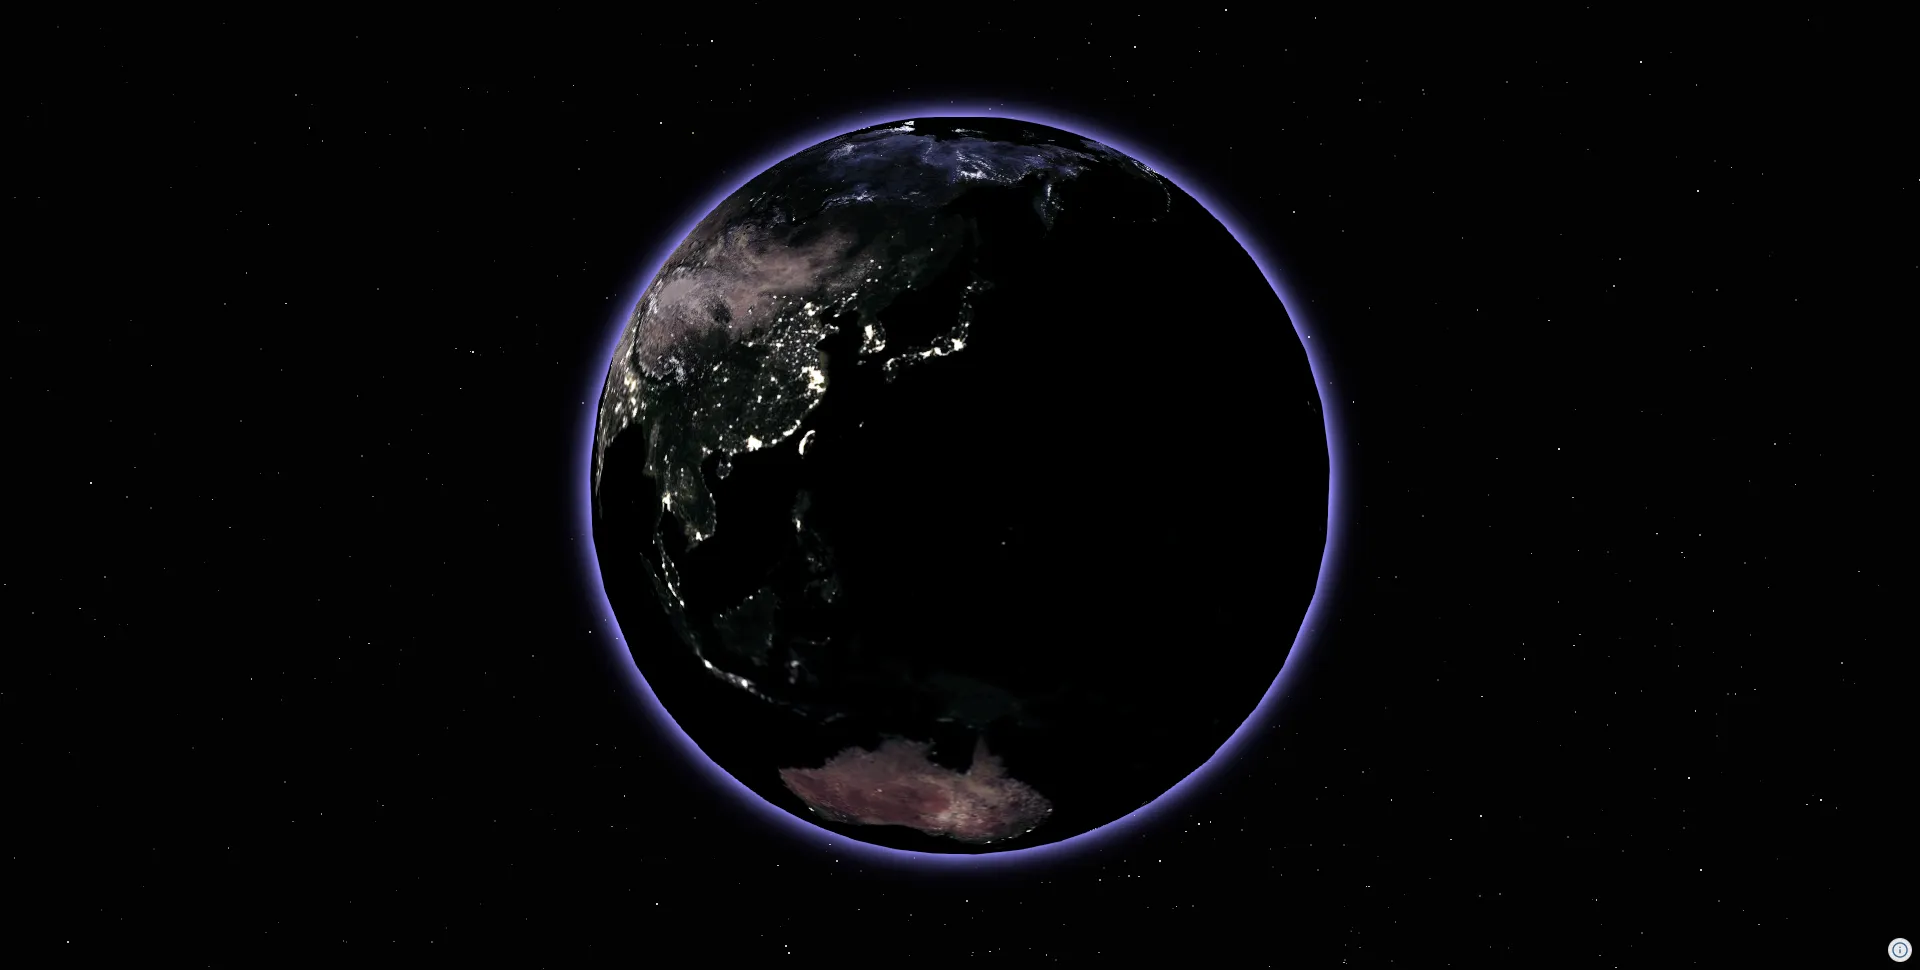
GeoJSONデータを読み込む
Section titled “GeoJSONデータを読み込む”空港間の航空交通量データを GeoJSON 形式で読み込みます。
import type { FeatureCollection, MultiLineString } from "geojson";
// 航空交通量データの型定義type AirportTrafficData = FeatureCollection<  MultiLineString,  {    S10b_001: string; // 出発空港    S10b_004: string; // 到着空港    S10b_005: number; // 距離    S10b_006: number; // 便数    S10b_007: number; // 旅客数    S10b_008: number; // 総輸送量    S10b_009: number; // 貨物量  }>;
// データを取得const response = await fetch( "https://assets.cms.reearth.io/assets/3b/63858d-9197-4b39-bbed-c17b6add52a4/airport-traffic-volume.geojson");const data: AirportTrafficData = await response.json();ColorMapを使ってデータに基づく色分けをする
Section titled “ColorMapを使ってデータに基づく色分けをする”ColorMap クラスを使うと、数値データを色にマッピングできます。ここでは便数に基づいて色を割り当てます。
import { Color, ColorMap, geodeticToVector3 } from "@navaramap/three";
// ref: https://matplotlib.org/stable/users/explain/colors/colormaps.htmlconst PLASMA_COLORMAP = new ColorMap("sequential", "Plasma", [  [0.050383, 0.029803, 0.527975],  [0.494877, 0.011990, 0.657865],  [0.798216, 0.280197, 0.469538],  [0.994324, 0.716681, 0.177208],]);
// 最大便数を取得(対数スケールで正規化)const maxTrafficLog = Math.max(  ...data.features.map((f) => Math.log(f.properties.S10b_006 + 1)));
// GeoJSON の各地物をアーチライン定義に変換const arcLines = data.features.map((feature) => {  const coords = feature.geometry.coordinates[0];  const source = { lng: coords[0][0], lat: coords[0][1] };  const destination = { lng: coords[1][0], lat: coords[1][1] };
  // 2点間の距離を計算(アニメーション速度の調整に使用)  const srcVec = geodeticToVector3({    lat: source.lat,    lng: source.lng,    height: 0,  });  const destVec = geodeticToVector3({    lat: destination.lat,    lng: destination.lng,    height: 0,  });  const distance = srcVec.distanceTo(destVec);
  // 便数を対数スケールで正規化(0〜1)  const trafficVolume = feature.properties.S10b_006;  const trafficVolumeLog = Math.log(trafficVolume + 1);  const normalizedTraffic = trafficVolumeLog / maxTrafficLog;
  // ColorMap で色を取得  const [r, g, b] = PLASMA_COLORMAP.linear(normalizedTraffic);  const color = new Color().setRGB(r, g, b);
return { thickness: 1.2, transparent: true, opacity: 0.3, segments: 64, height: 0, arcHeightScale: 0.3, srcColor: color, tgtColor: color, dashed: true, dashSize: 500000, dashOffset: Math.random() * 1000000, // ランダムな初期オフセット gapSize: 800000, geometry: [source, destination], distance, // アニメーション速度計算用 };});アーチラインオブジェクトを追加する
Section titled “アーチラインオブジェクトを追加する”import type { ArclineMeshDesc } from "@navaramap/three-default-descs";
const arcLineHandle = view.addMesh<ArclineMeshDesc>({ arcLines,});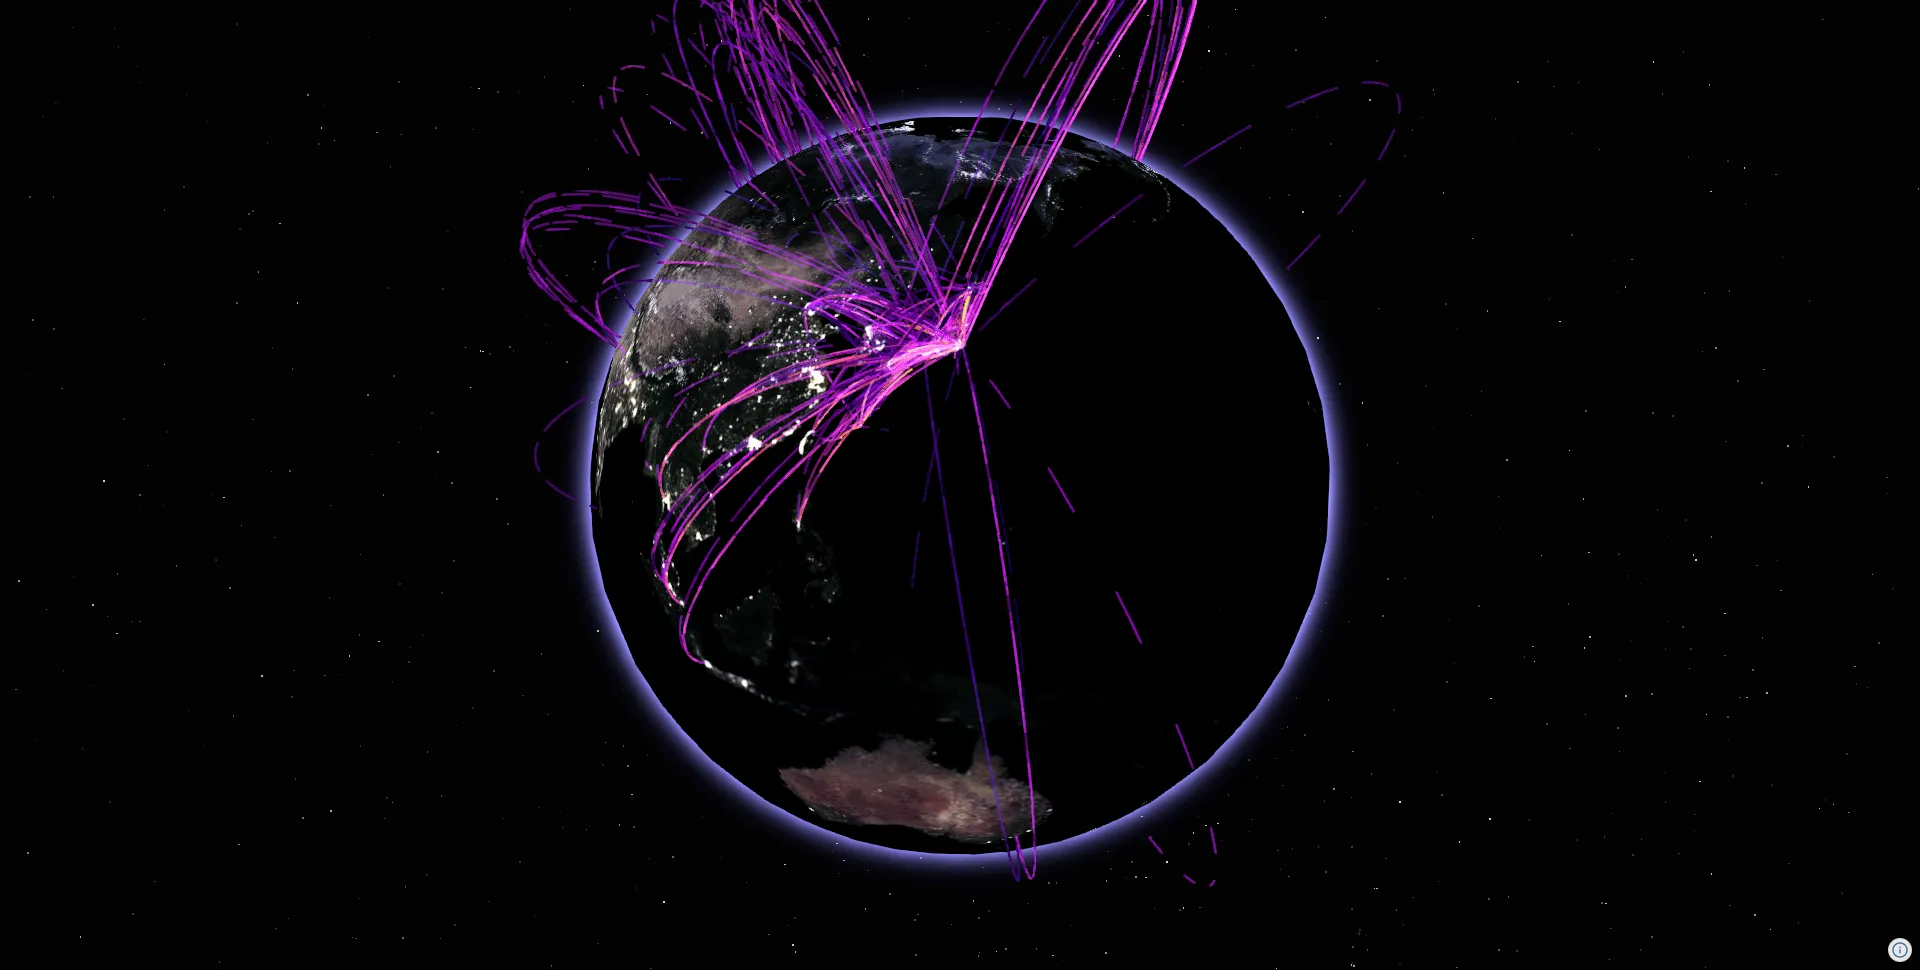
ダッシュアニメーションを追加する
Section titled “ダッシュアニメーションを追加する”view.on("preUpdate", ...) でダッシュオフセットを毎フレーム更新し、フローの方向性を表現します。preUpdate はビューが 1 フレームの更新処理に入る直前に発火するため、ここで書き換えた値はそのままそのフレームの描画に反映されます。距離に応じてアニメーション速度を調整すると、より自然な見た目になります。
// ダッシュアニメーション(出発地から目的地へ流れる)view.on("preUpdate", () => {  arcLines.forEach((arcLineDef) => {    // 距離に基づいてアニメーション速度を計算    const baseSpeed = 5000;    const distance = arcLineDef.distance || 1;    const speedMultiplier = Math.sqrt(distance / 2000000);    const speed = baseSpeed * speedMultiplier;
    arcLineDef.dashOffset = (arcLineDef.dashOffset ?? 0) + speed;  });
arcLineHandle.update({ arcLines });});import ThreeView, { Color, ColorMap, geodeticToVector3,} from "@navaramap/three";import { ToneMappingMode, type ArclineMeshDesc, type GlowGlobeMeshDesc,} from "@navaramap/three-default-descs";import { DefaultPlugin, type DefaultDescriptions } from "@navaramap/three-default-plugin";import { TileJsonPlugin } from "@navaramap/three-plugins";import type { FeatureCollection, MultiLineString } from "geojson";
// 航空交通量データの型定義type AirportTrafficData = FeatureCollection< MultiLineString, { S10b_001: string; S10b_004: string; S10b_005: number; S10b_006: number; S10b_007: number; S10b_008: number; S10b_009: number; }>;
// ref: https://matplotlib.org/stable/users/explain/colors/colormaps.htmlconst PLASMA_COLORMAP = new ColorMap("sequential", "Plasma", [ [0.050383, 0.029803, 0.527975], [0.494877, 0.011990, 0.657865], [0.798216, 0.280197, 0.469538], [0.994324, 0.716681, 0.177208],]);
// データの構築const constructData = async () => { const response = await fetch( "https://assets.cms.reearth.io/assets/3b/63858d-9197-4b39-bbed-c17b6add52a4/airport-traffic-volume.geojson" ); const data: AirportTrafficData = await response.json();
const maxTrafficLog = Math.max( ...data.features.map((f) => Math.log(f.properties.S10b_006 + 1)) );
const arcLines = data.features.map((feature) => { const coords = feature.geometry.coordinates[0]; const source = { lng: coords[0][0], lat: coords[0][1] }; const destination = { lng: coords[1][0], lat: coords[1][1] };
const srcVec = geodeticToVector3({ lat: source.lat, lng: source.lng, height: 0, }); const destVec = geodeticToVector3({ lat: destination.lat, lng: destination.lng, height: 0, }); const distance = srcVec.distanceTo(destVec);
const trafficVolume = feature.properties.S10b_006; const trafficVolumeLog = Math.log(trafficVolume + 1); const normalizedTraffic = trafficVolumeLog / maxTrafficLog;
const [r, g, b] = PLASMA_COLORMAP.linear(normalizedTraffic); const color = new Color().setRGB(r, g, b);
return { thickness: 1.2, transparent: true, opacity: 0.3, segments: 64, height: 0, arcHeightScale: 0.3, srcColor: color, tgtColor: color, dashed: true, dashSize: 500000, dashOffset: Math.random() * 1000000, gapSize: 800000, geometry: [source, destination], distance, }; });
return { arcLines };};
// メイン関数async function run() { const plugin = new DefaultPlugin(); const view = new ThreeView<DefaultDescriptions>({ backgroundColor: new Color().setStyle("#0b0a0d"), }); view.addPlugin(plugin);
const tilejson = new TileJsonPlugin(); view.addPlugin(tilejson);
await view.init();
view.atmosphere.date.setHours(8); view.toneMappingExposure = 10;
// アンビエントライト view.addLight({ ambient: {}, });
// 星空 view.addMesh({ stars: { intensity: 100, pointSize: 1.5, }, });
// トーンマッピング view.addEffect({ toneMapping: { mode: ToneMappingMode.REINHARD2, }, });
// アンチエイリアシング view.addEffect({ smaa: { quality: "ultra", }, });
// 衛星写真タイル const satelliteSource = await tilejson.addSource({ type: "raster-tile", url: "https://papers.reearth.land/bluemarble/tilejson.json", }); view.addLayer({ type: "raster", source: satelliteSource, });
// 夜景タイル(オプション) const nightSource = await tilejson.addSource({ type: "raster-tile", url: "https://papers.reearth.land/blackmarble/tilejson.json", }); view.addLayer({ type: "raster", source: nightSource, raster: { opacity: 0.8, }, });
// グローエフェクト view.addMesh<GlowGlobeMeshDesc>({ glowGlobe: { radiusScale: 1.2, coefficient: 0.43, exponent: 40.0, glowColor: new Color().setStyle("#938cff"), opacity: 0.5, }, });
// アーチラインデータを構築 const { arcLines } = await constructData();
// アーチラインオブジェクトを追加 const arcLineHandle = view.addMesh<ArclineMeshDesc>({ arcLines, });
// ダッシュアニメーション view.on("preUpdate", () => { arcLines.forEach((arcLineDef) => { const baseSpeed = 5000; const distance = arcLineDef.distance || 1; const speedMultiplier = Math.sqrt(distance / 2000000); const speed = baseSpeed * speedMultiplier;
arcLineDef.dashOffset = (arcLineDef.dashOffset ?? 0) + speed; });
arcLineHandle.update({ arcLines }); });
// カメラ設定 view.setCamera({ lng: 140, lat: 20, height: 12_600_000, heading: 0, pitch: -90, roll: 0 });}
run();